Reviewed by Mary McLaughlin, Special Education Teacher; M.S. SpEd


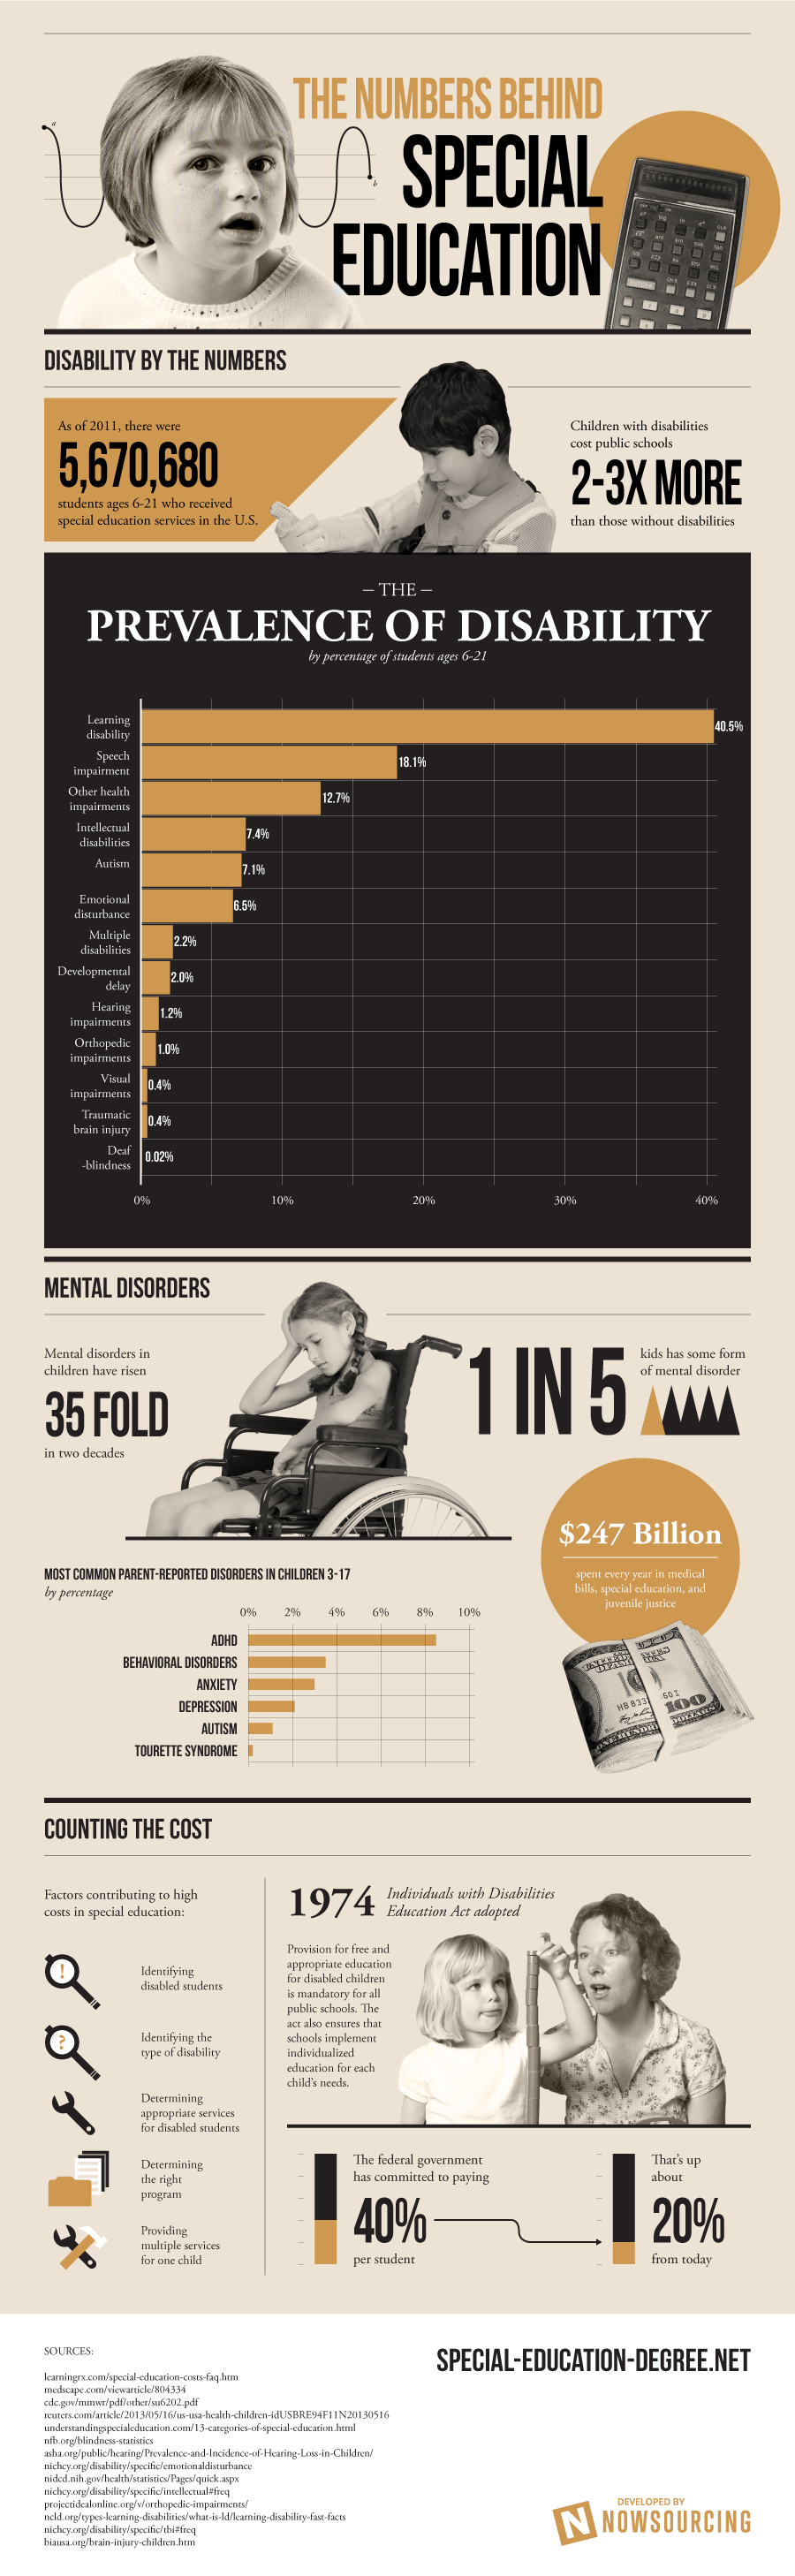
The Numbers Behind Special Education
Disability by the Numbers
● As of 2011, there were 5,670,680 students ages 6-21 who received special education services in the U.S.
● Children with disabilities cost public schools 2-3x more than those without disabilities
The Prevalence of Disabilities
by percentage of students ages 6-21)
○ (40.5 percent) in specific learning disability
○ (18.1 percent) in speech or language impairment
○ (7.4 percent) in intellectual disabilities
○ (6.5 percent) in emotional disturbance
○ (2.2 percent) in multiple disabilities
○ (1.2 percent) in hearing impairments
○ (1.0 percent) in orthopedic impairments
○ (12.7 percent) in other health impairments
○ (0.4 percent) in visual impairments
○ (7.1 percent) in autism
○ (0.02 percent) in deaf-blindness
○ (0.4 percent) in traumatic brain injury
○ (2.0 percent) in developmental delay
Mental Disorders:
Mental disorders in children has risen 35 fold in two decades
● 1 in 5 kids has some form of mental disorder
○ $247 billion spent / year in medical bills, special education, and juvenile justice
Most common parent-reported disorders in children 3-17:
○ ADHD – 8.5%
○ Behavioral disorders – 3.5%
○ Anxiety – 3%
○ Depression – 2.1%
○ Autism – 1.1%
○ Tourette Syndrome – 0.2%
Counting the Costs:
Factors contributing to high costs in special education:
○ Identifying disabled students
○ Identifying the type of disability
○ Determining appropriate services for disabled students
○ Determining the right program
○ Providing multiple services for one child
1974: Individuals with Disabilities Education Act adopted
Provision for free and appropriate education for disabled children is mandatory for all public schools. The act also ensures that schools implement individualized education for each child’s needs.
■ The federal government has committed to paying 40% per student
■ That’s up about 20% from today
Sources:
http://www.learningrx.com/special-education-costs-faq.htm
http://www.medscape.com/viewarticle/804334
http://www.cdc.gov/mmwr/pdf/other/su6202.pdf
https://www.reuters.com/article/us-usa-health-children/up-to-1-in-5-children-suffer-from-mental-disorder-cdc-idUSBRE94F11N20130516
http://www.understandingspecialeducation.com/13-categories-of-special-education.html
https://nfb.org/blindness-statistics
http://www.asha.org/public/hearing/Prevalence-and-Incidence-of-Hearing-Loss-in-Children/
http://nichcy.org/disability/specific/emotionaldisturbance
https://www.nidcd.nih.gov/health/statistics/Pages/quick.aspx
http://nichcy.org/disability/specific/intellectual#freq
http://www.projectidealonline.org/v/orthopedic-impairments/
http://nichcy.org/disability/specific/tbi#freq
https://www.biausa.org/brain-injury/about-brain-injury/children-what-to-expect